Today, 22nd September 2021, Ghana Statistical Service (GSS) released a Preliminary Report which gives the provisional results from the 2021 Population and Housing Census (PHC).
Key Takeaways
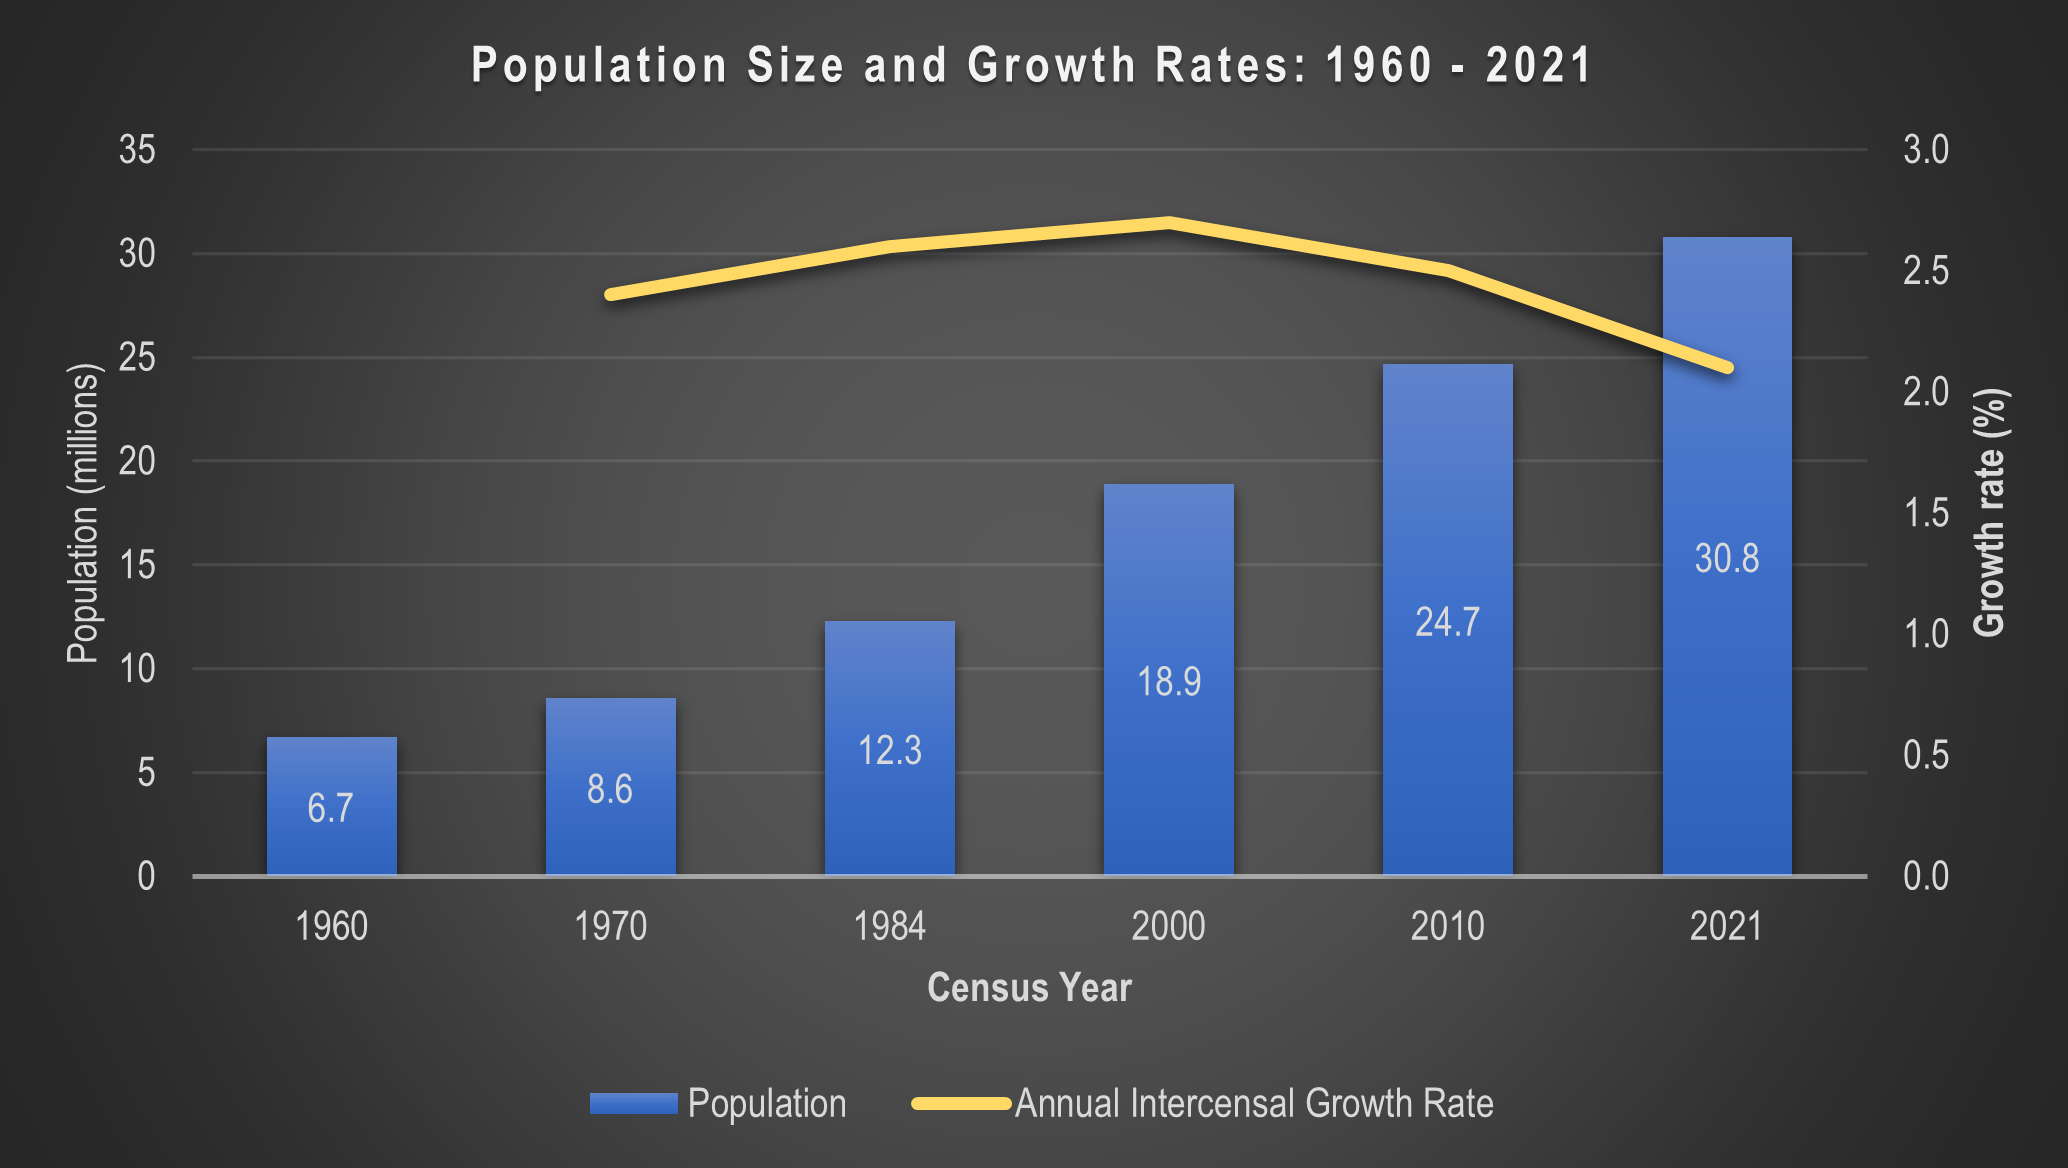
- Ghana’s population figure from the 2021 PHC is 30.8 million.
- The population has grown almost fivefold since the first post-independence census was conducted in 1960.
- Ghana’s population is growing, but at a declining rate compared with previous censuses.
- Females make up a greater proportion of the population in the 2021 PHC as has been the trend for the past four censuses. They outnumber males in 10 out of the 16 regions.
- Greater Accra has overtaken Ashanti as the nation’s most populous region.
- Ahafo has replaced Upper West as the nation’s least populous region.
- Average household size, which has been on the decline since 2000, is 3.6 members.
- Out of the 10.7 million structures listed, 20% were metal containers, kiosks, and wooden structures.
- One out of every five of the structures listed was not fully completed.
- The information on structure usage indicated six out of every 10 structures were for residential use.
About the 2021 Population and Housing Census
The 2021 Population and Housing Census (PHC), Ghana’s first fully digital census, employed technology in all aspects of its implementation. It leveraged on technology available to improve operational efficiency, enhance the quality of the data collected and be able to release results in a timely manner. To learn more about the uniqueness of the 2021 PHC, visit the census website.
The 2021 PHC counted and collected detailed information on all persons that spent the Census Night, that is Sunday 27th June 2021, in the country (de facto approach). The initial enumeration period was from 27th June to 11th July, with a mop-up period, first for one week and subsequently extending it to 15th August in some areas with challenges. Prior to the Census Night, the listing of structures took place between 13th and 25th June, 2021. Structures listed were completed buildings, uncompleted buildings at various levels of completion above window level and unconventional structures (such as metal containers, and kiosks).
Scope of the Preliminary Report
This press release highlights findings from the 2021 PHC Preliminary Report which contains provisional results on population size and sex composition, population density, and structures by region.
NB: The results presented in the Preliminary Report are provisional. These statistics will be used as provisional figures until the final results are released in November. The final results may differ slightly from the statistics presented in the preliminary report, which is normal in censuses. Read the pre-release fact sheet for answers to frequently asked questions about the provisional results.
Summary of Provisional Results
The de facto population in Ghana on Census Night was 30,792,608 made up of 15,610,149 females and 15,182,459 males.
Overall, females make up 50.7% of the population and males 49.3%, giving a national sex ratio of 97 males for every 100 females.
In all, 8,345,414 households were enumerated, with an average national household size of 3.6 persons.
The national population density in the 2021 PHC is 129 persons per square kilometre.
Over ten million (10,661,421) structures were counted during the listing, out of which 8,547,391 (80.2%) are fully completed i.e. roofed with windows and doors fixed.
Confidence Levels in Provisional Results

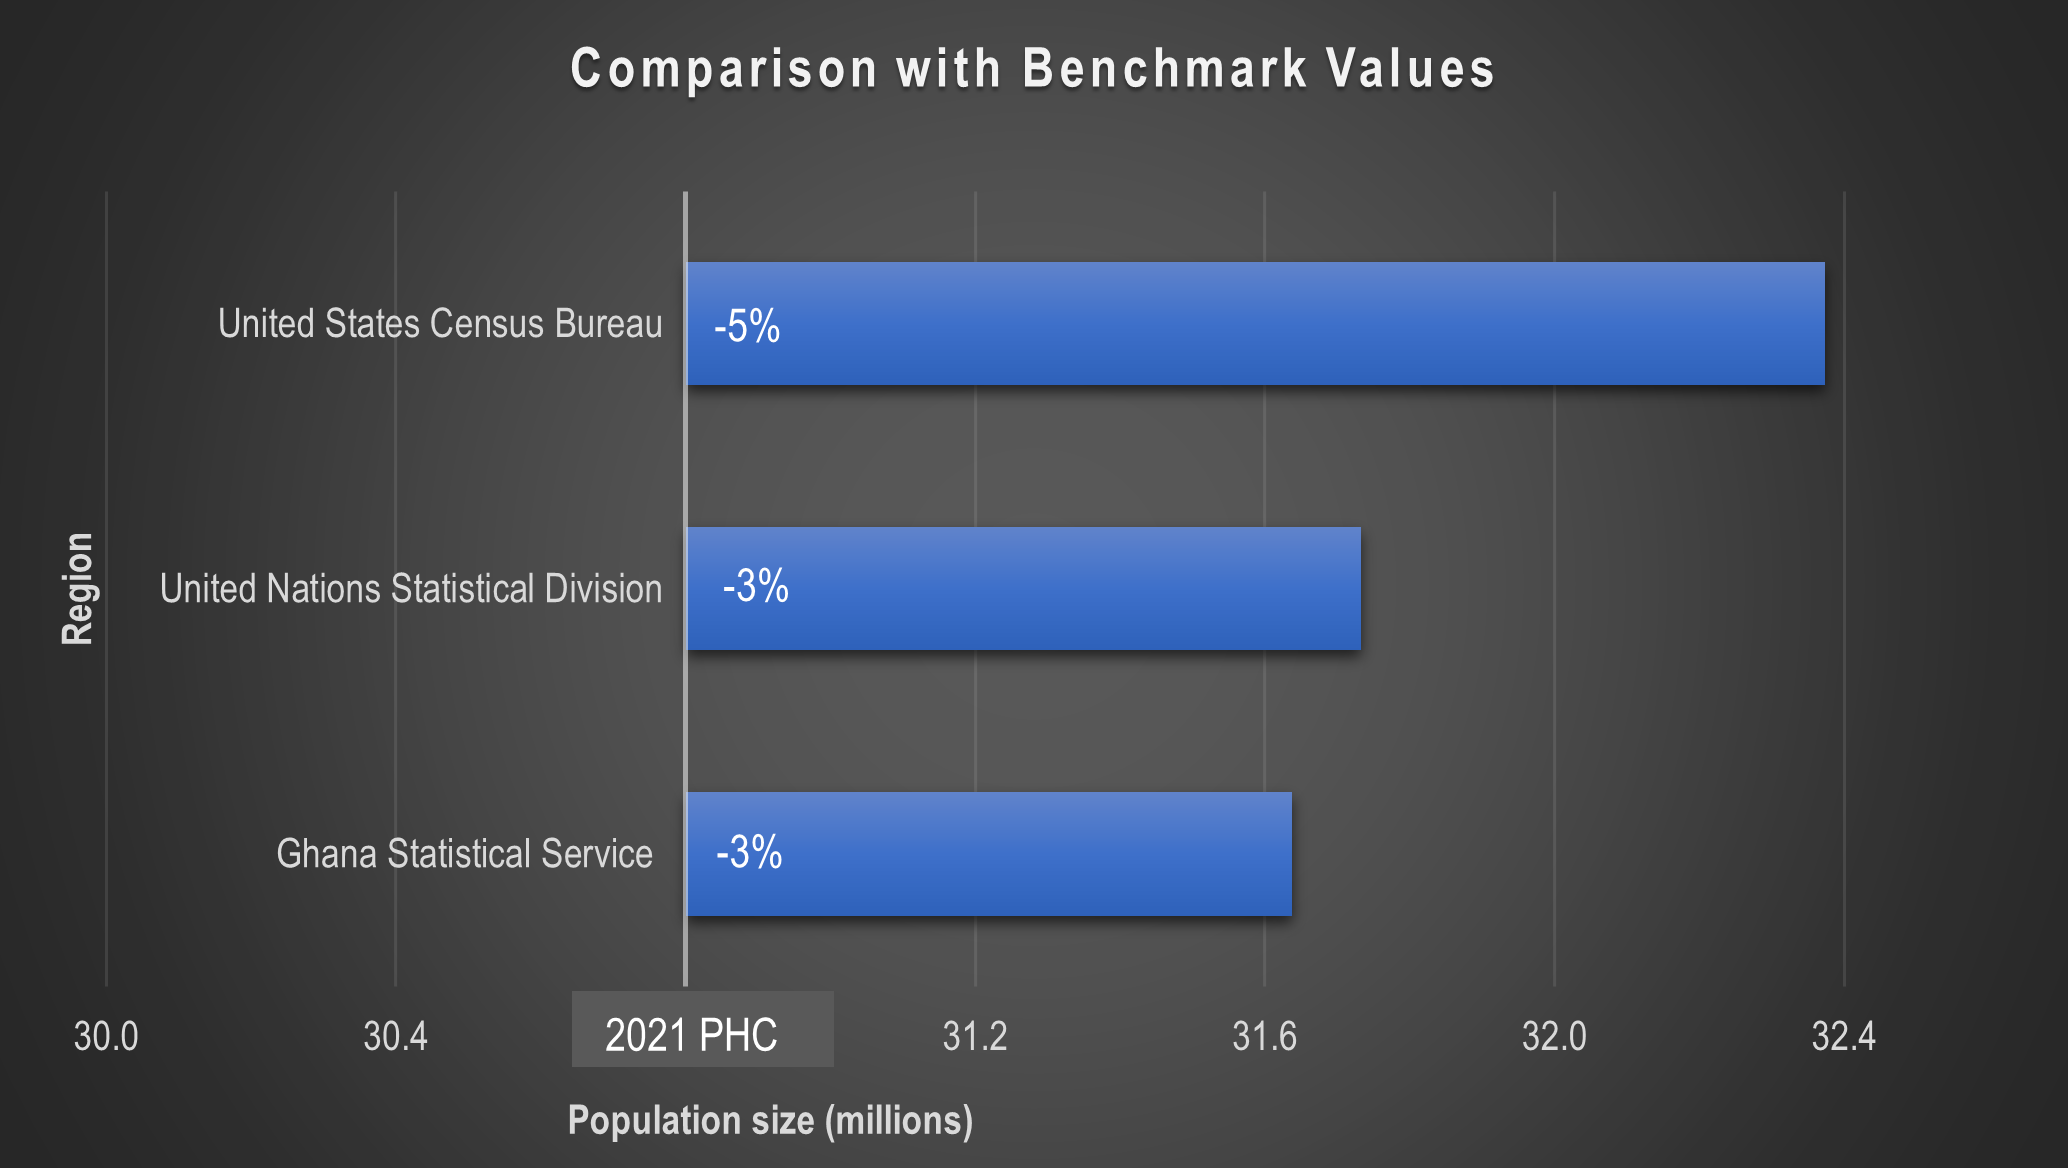
All indicators show the census results are in line with expectations based on the benchmark values used to assess coverage of the 2021 PHC. The 2021 PHC was compared with a range of benchmark indicators for this assessment including the 2010 PHC population (+24.9% of 24,658,823), GSS 2021 mid-year population projections (-2.7% of 31,636,804), the United Nations 2021 mid-year medium variant population projections (-3.0% of 31,732,129), and the U.S. Census Bureau (-4.9% of 32,372,889).
For the listing as well, the numbers recorded were in line with benchmark indicators. The number of structures listed was within range (+6.1% of 10,051,915) of the expected number of structures predicted using building footprints derived from satellite imagery.
Population Changes Since the 2010 Census

The population has increased by 6.1 million from the 24.7 million recorded in 2010, constituting an annual intercensal growth rate of 2.1%. This rate is less than what was observed in the previous intercensal period (2000 – 2010: 2.5%) and is the lowest observed since independence. At this rate, the country ‘s population will double within 33 years. And by 2050, the population of Ghana would be over 50 million.
The sex ratio of 97 males for 100 females in 2021 represented a slight increase over the sex ratio of 95 recorded in 2010. The 1960 census is the only post-independence census which recorded more males than females (102 males to 100 females) . Since then, sex ratios have declined until the uptick observed in 2021. Regional sex ratios in the 2021 PHC range from 91 males for every 100 females in the Volta Region to 105 males to every 100 females in the Western North Region, and these rates are consistent with the findings from the 2010 Census where the then Volta Region had the lowest sex ratio of 89 with the then Western Region recording the highest of 104.
The total number of households has grown by 2.8 million (representing a 52% increase) over the 5,467,136 households enumerated in 2010.
Household size declined by 0.8, from 4.4 in the 2010 census. A similar decline of 0.9 was observed between the 2010 and 2000 censuses.
The population density at the national level increased by 26 persons per square kilometre over the 103 recorded in 2010.
The 2021 PHC is the first time that data was collected on all structures regardless of use. Previous censuses only collected information on structures used for residential purposes. The 2010 PHC recorded 3.4 million structures for residential use, which is 2.5 million less the 5.9 million counted in 2021.
Regional Differences
NB: For regional comparisons with the last census, the 2010 population figures have been reconstituted using the district populations recorded.

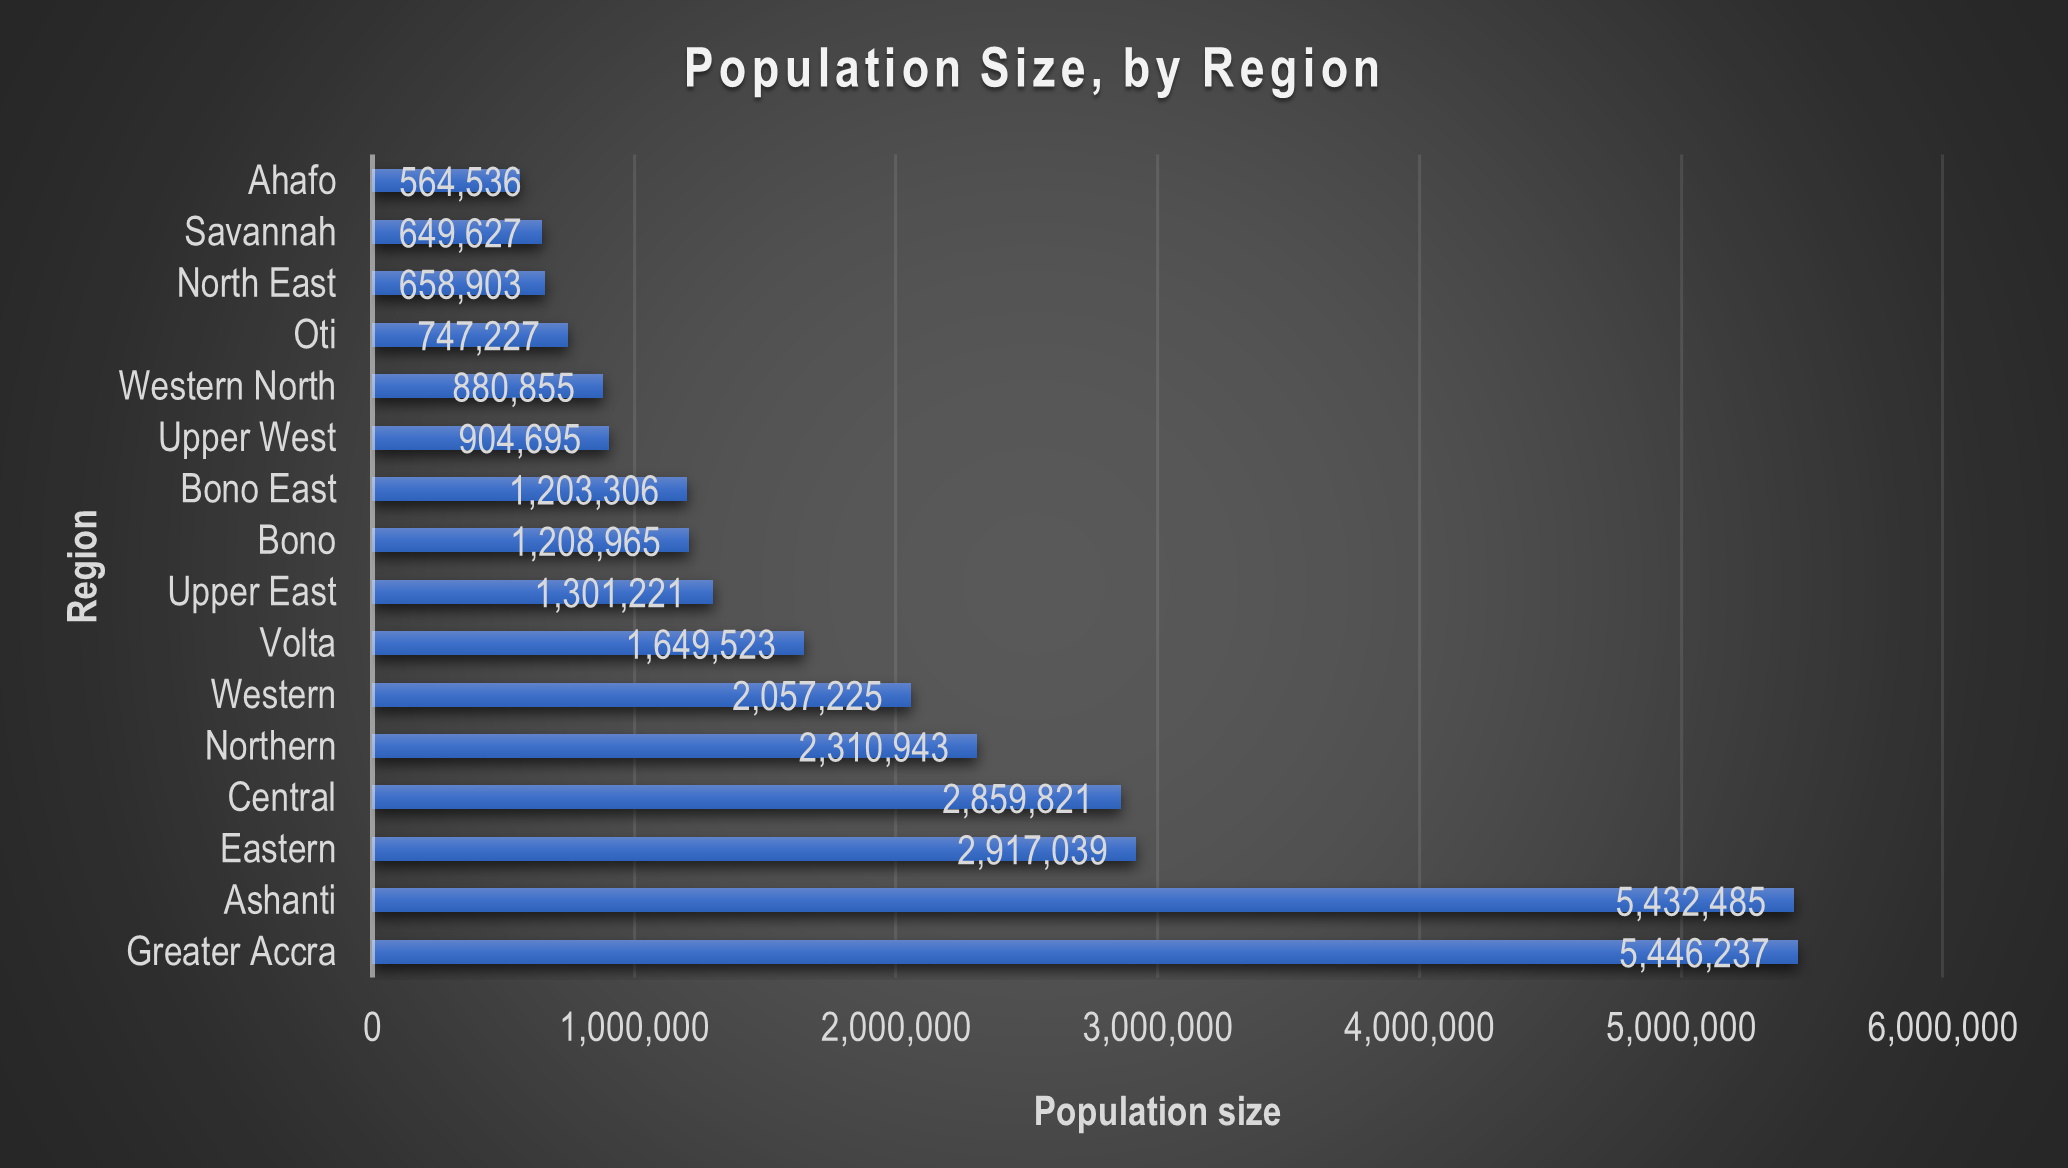
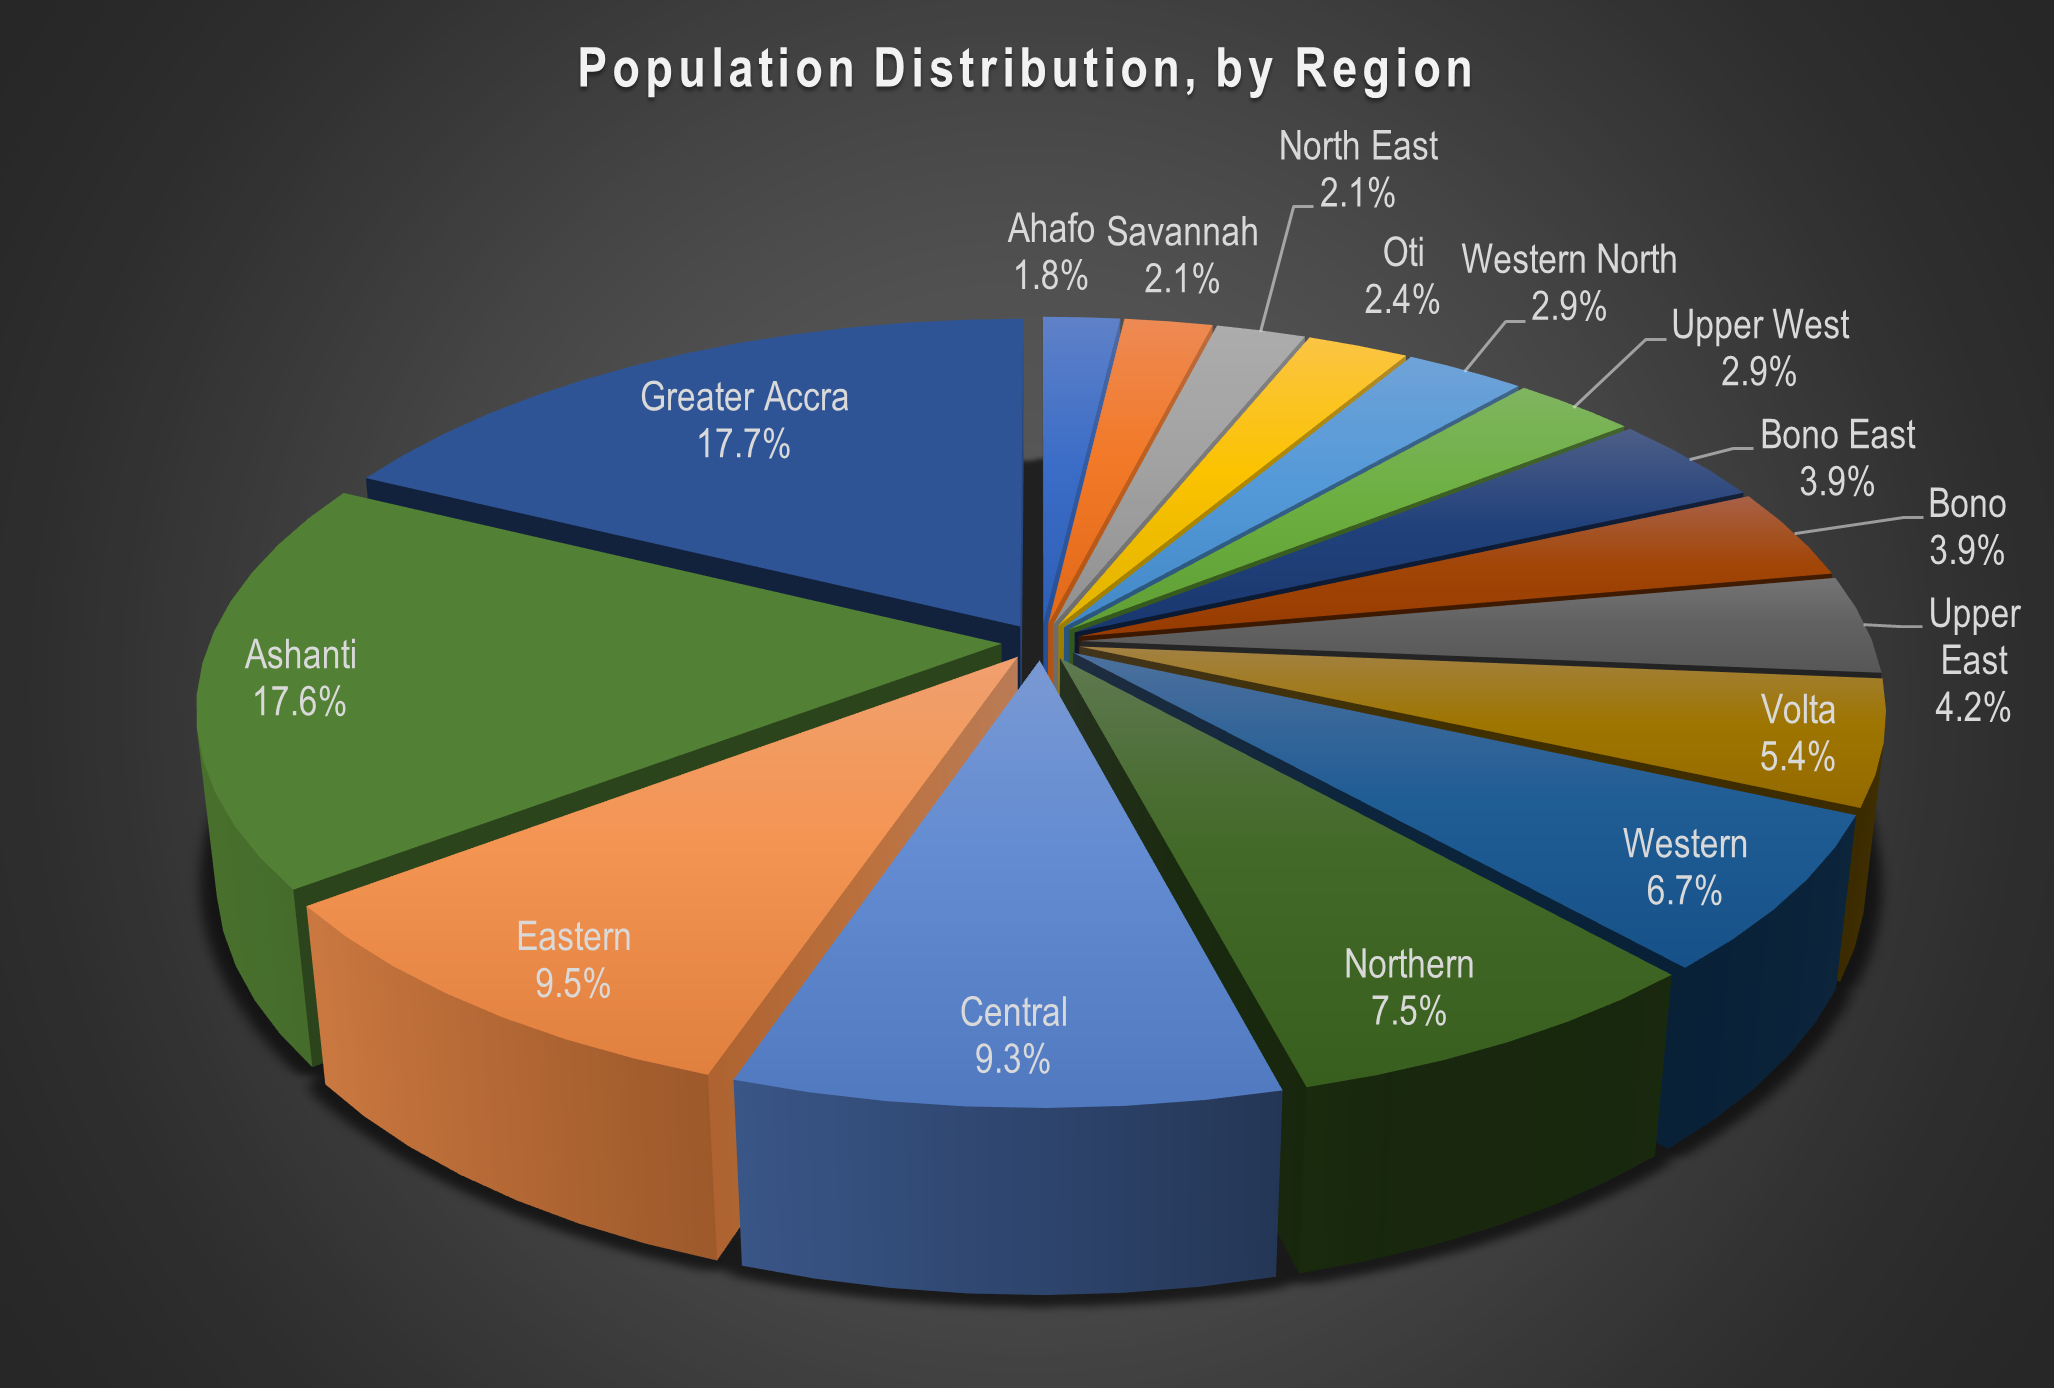
Greater Accra Region is now the most populous region in Ghana, overtaking the Ashanti Region which has been the most populous region since 1970. Ashanti Region closely follows as the second most populous region. These regions are both almost twice (1.9) times the size of the third most populous region, Eastern Region.
The Central Region is now the fourth most populous region following the splitting of the former Western, Brong Ahafo and Northern Regions who were all more populous than Central Region in 2010. The four most populous regions make up over half (54%) of the total population.
The Ahafo Region is the least populous region taking the place of the Upper West which had been the least populous in all the previous post-independence censuses. The Savannah and North East Regions are the second and third least populous regions respectively.
Disparities in the population size across region have been the largest observed since 1960 when Ghana conducted its first post-independence census. In 1960, the most populous region, Eastern, was almost five times (4.63) the size of Upper West, the least populous. In 2010, the most populous region, Ashanti was almost seven times (6.81) the size of the least populous, Upper West. In 2021, the two most populous regions, Greater Accra and Ashanti, are almost 10 times (9.6) the size of Ahafo, the least populous. There are 11 other regions that are at least twice as populous as Ahafo, and six that are thrice as populous. For Savannah and North East, there are seven other regions twice as populous and five that are thrice as populous.
The current Northern Region observed the largest change in population with an almost 50% increase over its population in 2010. The two other regions that made up the then Northern Region in 2010, North East and Savannah, had the second and third largest intercensal increases (41.7% and 38.4%) respectively. The next highest change recorded was in Greater Accra with an addition of 35.8%. The Eastern Region, followed by the Volta Region, recorded the lowest intercensal change (adding 10.8% and 11.4% respectively to their populations). The range of these figures highlight the regional disparities in population change from the previous censuses.

Greater Accra and Eastern Region recorded the smallest household size of 3.2 which is almost half the household size of 6.0 recorded in the North East Region, the largest household size. In nine out of the 16 regions, households had less than four members, on the average, with the smaller household sizes observed in the southern part of the country.
Conversely, the larger population density figures are observed in the southern part of the country. The region with the highest population density is Greater Accra with 1,236 persons per square kilometre, which is significantly higher than what is observed in regions. This figure is almost six (5.8) times the density observed in Ashanti, the region with the second highest density, almost 100 times (91.5) more people per square kilometre than Savannah region which has 14 persons per square kilometre. Upper West and Bono East represent the second and third most sparsely populated regions.
Regional differences in the distribution of structures mimic that of population distribution. Generally, population size is correlated with the number of structures: the regions with high proportions of the population tended to have the most structures and vice-versa. North East, the region with the third least number of persons, recorded the least number of structures, followed by Ahafo and Savannah, regions with the first and second least proportions of population respectively.
Greater Accra Region recorded the highest number of both residential and non-residential structures with 19.3% of all the total structures listed. The number of structures in Greater Accra is greater than the number of structures in six regions (North East, Savannah, Ahafo, Upper West, Oti, Upper East) combined. Three regions (Greater Accra, Ashanti, Eastern) combined have almost half (47.3%) of all structures listed.
At the national level, the usage reported for six out of every ten structures (59.6%) was residential with the regional figures starting from just over half (53.1%) in the Western North and Bono Regions (53.7%) to almost three-quarters (73.5%) in the Savannah Region.
Note: information on usage of structures was not collected for structures at lintel level without roof, window level, or concrete/metal/pillars levels
Data Quality
The 2021 PHC instituted several data quality monitoring mechanisms and leveraged technology to implement interventions towards ensuring complete and accurate coverage. These included the use of GIS technology and geospatial resources, such as collecting the GPS coordinates of all structures, use of census dashboard for real-time monitoring and continuous data validation by Data Quality Monitors at the various levels of operations.
These strategies made it possible to continuously assess data quality and correct errors and inconsistencies while enumerators were still on the field. The approach, and with public sensitisation programmes, created an alert, enthusiastic and proactive public leading to avoidance of duplications and omissions as well as eliminating fabrications. Learn more about the 2021 PHC data quality assurance process in our pre-release fact sheet.
The technical documentation on the enumeration and data quality assurance procedures are available under the instruments and training materials section of the census website.
Data Confidentiality
Only aggregated data is reported and is the norm for the rest of the results in accordance with the Statistical Service Act, 2019 (Act 1003). The Act places a legal restriction on publishing particulars on individuals. All personal details are protected and removed from all publications and datasets to protect the confidentiality of respondents.
Accessing these Provisional Results
The full preliminary report can be accessed online from the 2021 Population and Housing Census (PHC) at www.census2021.statsghana.gov.gh/dissemination.
Upcoming 2021 PHC Product Releases
Information on upcoming releases and data products are available in the 2021 PHC Product Release calendar which can be downloaded here.
The upcoming releases are on residential proximity to essential services and the general report on population and housing characteristics from the different modules of the census questionnaire. To learn more about the indicators to be presented in subsequent releases, download the 100 uses of census data document, the information sheet on the census questionnaires and the full questionnaires online.
Appreciation
Management of the Ghana Statistical Service expresses its appreciation to all Census Committees, Census Officials, Field Officers, Partners, the Media, Stakeholders, Respondents, and the General Public who participated in the census and looks forward to continued engagements during the dissemination phase of this important national activity.
